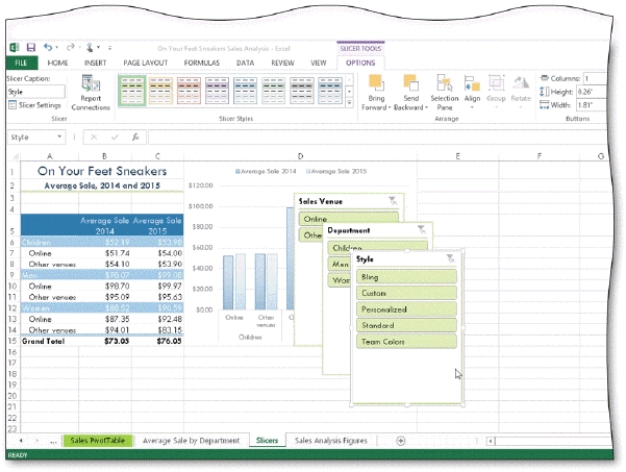
-As shown in the accompanying figure, _________________________ are graphic objects that contain buttons you tap or click to filter the data in PivotTables and PivotCharts.
Correct Answer:
Verified
Q60: All types of Excel charts can have
Q61: In Excel, you add a trendline to
Q62: Formatting techniques that work for regular tables
Q63: Changes in the view of a PivotChart
Q64: PivotChart reports often are used to represent
Q66: PivotTable rows are drawn from columns in
Q67: When analyzing a chart that contains a
Q68: When the data in a PivotTable report
Q69: Some features of PivotTables and PivotCharts are
Q70: Using a(n) trendline on certain Excel charts
Unlock this Answer For Free Now!
View this answer and more for free by performing one of the following actions

Scan the QR code to install the App and get 2 free unlocks

Unlock quizzes for free by uploading documents