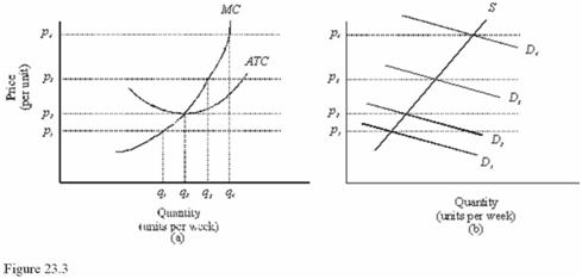
 In Figure 23.3, diagram "a" presents the cost curves that are relevant to a firm's production decision, and diagram "b" shows the market demand and supply curves for the market.Use both diagrams to answer the following question: In Figure 23.3, if market demand is at D1, the firm should
A) Leave the market.
B) Produce q1.
C) Shut down.
D) Do any of the above depending on the position of the AVC and the length of the time period.
Correct Answer:
Verified
Q84: The equilibrium price of a good or
Q85: Q86: Bib's Soccer Ball Company produces 800 soccer Q88: Q89: Q89: When a computer firm is producing a Q90: High profits in a particular industry indicate Q94: When an athletic shoe company is producing Unlock this Answer For Free Now! View this answer and more for free by performing one of the following actions Scan the QR code to install the App and get 2 free unlocks Unlock quizzes for free by uploading documents![]()
![]()
![]()

