Here is an ogive of the distribution of students' marks on their statistics test. 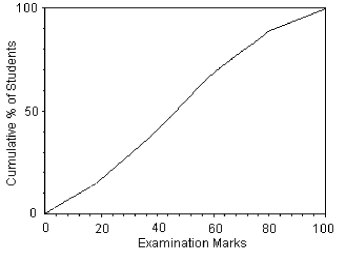 Choose the boxplot that represents the given data.
I 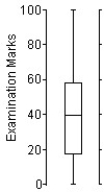
II 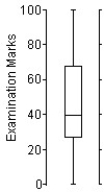
III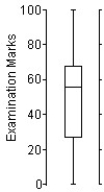
IV 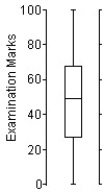
V 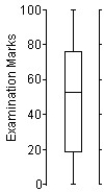
A) I
B) II
C) III
D) IV
E) V
Correct Answer:
Verified
Q104: The ages of the 21 members
Q105: A local ice cream shop hand scoops
Q106: A small company employs a supervisor at
Q107: Here are the summary statistics for
Q108: Here are the summary statistics for
Q110: The weights (in pounds)of 30 newborn
Q111: The normal monthly precipitation (in inches)for
Q112: The test scores of 40 students
Q113: Here are the highest temperatures ever recorded
Q114: Here are the average mathematics achievement
Unlock this Answer For Free Now!
View this answer and more for free by performing one of the following actions

Scan the QR code to install the App and get 2 free unlocks

Unlock quizzes for free by uploading documents