Shown below are the boxplot and summary statistics for the heights,in centimetres,of a class of Grade 3 students in Halifax,NS. 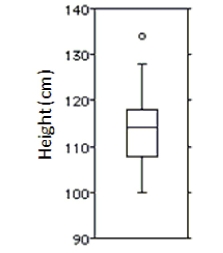 Which measures of centre and spread would you use for this distribution?
A) Median and standard deviation because the outlier affects the mean.
B) Mean and standard deviation because the outlier affects the mean.
C) Mean and IQR because the outlier does not really affect the mean.
D) Median and IQR because the outlier significantly affects the mean.
E) Mean and standard deviation because the outlier does not really affect the mean.
Correct Answer:
Verified
Q88: Here are the commutes (in kilometres)for a
Q89: The weekly salaries (in dollars)of 24
Q90: Here are the average mathematics achievement
Q91: Which set has the largest standard
Q92: Shown below are the histogram and
Q94: The ages of the 21 members of
Q95: Shown below are the boxplot and the
Q96: Shown below are the boxplot and the
Q97: Shown below are the boxplot and the
Q98: A sewing supply company has a
Unlock this Answer For Free Now!
View this answer and more for free by performing one of the following actions

Scan the QR code to install the App and get 2 free unlocks

Unlock quizzes for free by uploading documents