The histograms display the body fat percentages of 42 female students and 48 male students taking a college health course.For which of the variables depicted in the histograms would you be most satisfied to summarize the centre with a mean? Explain. 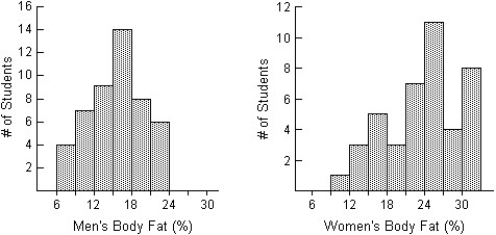
A) The histogram of Women's Body Fat is skewed on the left.That makes it the best candidate of summarizing with a mean.
B) The histogram of Women's Body Fat shows no outliers.That makes it the best candidate of summarizing with a mean.
C) The histogram of Men's Body Fat is most nearly symmetric,is not strongly skewed and shows no outliers.That makes it the best candidate of summarizing with a mean.
D) The histogram of Women's Body Fat is most nearly symmetric,is not strongly skewed and shows no outliers.That makes it the best candidate of summarizing with a mean.
E) The histogram of Men's Body Fat is skewed on the left.That makes it the best candidate of summarizing with a mean.
Correct Answer:
Verified
Q18: The histogram shows the sizes (in acres)of
Q19: The diastolic blood pressures,in mm Hg,for a
Q20: The data below represent the midterm grades
Q21: The stem-and-leaf diagram shows the ages
Q22: A weight-loss company used the following histogram
Q24: Office workers were asked how long
Q25: Here are summary statistics of the
Q26: In May 2014,17 coffee shops in
Q27: Here is the stem-and-leaf display of
Q28: A small company employs a supervisor at
Unlock this Answer For Free Now!
View this answer and more for free by performing one of the following actions

Scan the QR code to install the App and get 2 free unlocks

Unlock quizzes for free by uploading documents