A dotplot of the number of tornadoes each year in a certain county from 1948 to 2004 is given.Each dot represents a year in which there were that many tornadoes. 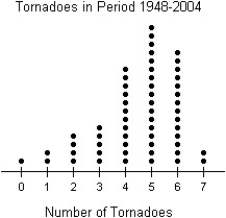
A) The distribution of the number of tornadoes per year is unimodal and symmetric,with a centre around 5 tornadoes per year.The number of tornadoes per year ranges from 0 to 7.
B) The distribution of the number of tornadoes per year is unimodal and skewed to the left,with a centre around 3.5 tornadoes per year.The number of tornadoes per year ranges from 0 to 7.
C) The distribution of the number of tornadoes per year is unimodal and symmetric,with a centre around 3.5 tornadoes per year.The number of tornadoes per year ranges from 0 to 7.
D) The distribution of the number of tornadoes per year is unimodal and skewed to the left,with a centre around 5 tornadoes per year.The number of tornadoes per year ranges from 0 to 7.
E) The distribution of the number of tornadoes per year is unimodal and skewed to the right,with a centre around 5 tornadoes per year.The number of tornadoes per year ranges from 0 to 7.
Correct Answer:
Verified
Q35: A business owner recorded her annual
Q36: A student at a local university
Q37: The following stem-and-leaf display shows the
Q38: Shown below are the histogram and
Q39: Students were asked to make a
Q41: Here are the number of baseball games
Q42: Here are the grocery bills,in dollars,for
Q43: Jody got a bank statement each month
Q44: The histograms show the cost of living,in
Q45: A consumer group surveyed the prices for
Unlock this Answer For Free Now!
View this answer and more for free by performing one of the following actions

Scan the QR code to install the App and get 2 free unlocks

Unlock quizzes for free by uploading documents