The table below shows the age and annual income of 12 randomly selected college graduates all living in the same city. Age Annual Income (dollars)
26 28,520
31 36,750
55 72,155
47 43,225
38 34,197
50 60,030
29 31,625
33 55,975
40 37,064
52 75,082
25 19,055
The scatter plot and regression equation are shown below: 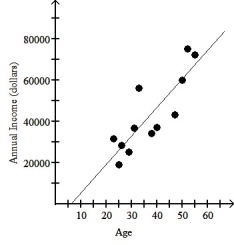 The regression analysis of this data yields the following values: R2 = 0.7182
Use this model to predict the annual income of a 56 year old college graduate living in this city.
A) $77,333
B) $61,367
C) $85,780
D) $70,230
E) $68,886
Correct Answer:
Verified
Q22: An economist noticed that nations with more
Q23: The table below displays the latitude
Q24: The figure below shows the association between
Q25: A study of consumer behavior finds a
Q26: The figure below shows the association between
Q27: A study finds a strong positive association
Q28: The figure below examines the association between
Q29: A university studied students' grades and established
Q30: A college admissions officer in the U.S.A.,defending
Q32: A reporter studied the causes of
Unlock this Answer For Free Now!
View this answer and more for free by performing one of the following actions

Scan the QR code to install the App and get 2 free unlocks

Unlock quizzes for free by uploading documents