Here Are Plots for Studentized Residuals Against Chest Compare the Regression with the Previous One
Here are plots for Studentized residuals against Chest. 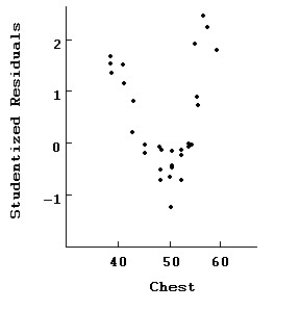 Here is the same regression with the two data points with residuals above 2 removed:
Dependent variable is: Weight
30 total bears of which 2 are missing
R-squared = 93.8% R-squared (adjusted)= 93.0%
s = 7.22 with 28 - 4 = 24 degrees of freedom Compare the regression with the previous one.In particular,which model is likely to make the best prediction of weight? Which seems to fit the data better?
Correct Answer:
Verified
View Answer
Unlock this answer now
Get Access to more Verified Answers free of charge
Q11: Here are plots of data for Studentized
Q12: The manager of a human resources
Q13: The manager of a human resources
Q14: Here are histograms of the leverage and
Q15: The manager of a human resources
Q17: Here are plots of data for Studentized
Q18: Here is a histogram of leverages for
Q19: How would you interpret the coefficient of
Q20: The manager of a human resources
Q21: A real estate agent wishes to predict
Unlock this Answer For Free Now!
View this answer and more for free by performing one of the following actions

Scan the QR code to install the App and get 2 free unlocks

Unlock quizzes for free by uploading documents