Use the following to answer questions
Figure: Long-Run Aggregate Supply Curves 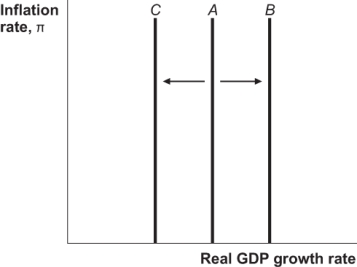
-(Figure: Long-Run Aggregate Supply Curves) Which of the following can explain the shift of the long-run aggregate supply curve from A to C in the figure?
A) development of new technology
B) an increase in the nation's factors of production
C) negative supply shock
D) increase in oil supply
Correct Answer:
Verified
Q58: If velocity is constant,the growth rate of
Q59: In the equation
Q60: The aggregate demand curve indicates that at
Q61: An increase in inflation will cause the
Q62: A real shock causes:
A) a shift of
Q64: A major hurricane hitting the East Coast
Q65: A negative real shock causes the long-run
Q66: Use the following to answer questions
Figure:
Q67: On a given aggregate demand curve,if the
Q68: The position of the long-run aggregate supply
Unlock this Answer For Free Now!
View this answer and more for free by performing one of the following actions

Scan the QR code to install the App and get 2 free unlocks

Unlock quizzes for free by uploading documents