Figure: Demand-Driven Price Change 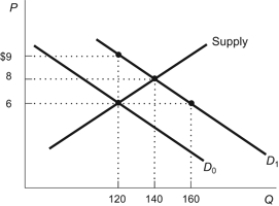 Refer to the figure.When the demand curve shifts from D0 to D1,the equilibrium price rises to:
A) $9 and the equilibrium quantity rises to 120.
B) $9 and the equilibrium quantity rises to 160.
C) $8 and the equilibrium quantity rises to 140.
D) $8 and the equilibrium quantity rises to 160.
Correct Answer:
Verified
Q95: Laboratory experiments by Vernon Smith support:
A) the
Q104: Figure: Supply-Driven Price Change Q105: Which of the following would NOT lead Q107: Which of the following might explain why Q111: An increase in demand and a decrease Q112: If hipsters decide that Pabst Blue Ribbon Q114: In markets for manufactured goods, a new Q117: Five new sellers enter a market (that Q129: How did the spread of the Internet Q139: How did the spread of the Internet![]()
Unlock this Answer For Free Now!
View this answer and more for free by performing one of the following actions

Scan the QR code to install the App and get 2 free unlocks

Unlock quizzes for free by uploading documents