Multiple Choice
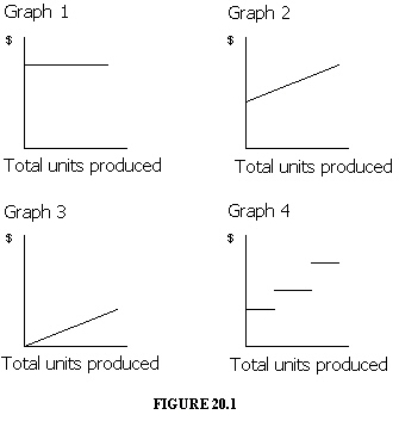 Which of the graphs in Figure 20-1 illustrates the behavior of a total variable cost?
A) Graph 2
B) Graph 3
C) Graph 4
D) Graph 1
Correct Answer:
Verified
Related Questions
Q61: Which of the following costs is an
Q62: Which of the following is an example
Q64: Which of the following costs is a
Q67: The three most common cost behavior classifications
Q67: Cost behavior refers to the manner in
Q68: The graph of a variable cost when
Q68: For purposes of analysis, mixed costs are
Unlock this Answer For Free Now!
View this answer and more for free by performing one of the following actions

Scan the QR code to install the App and get 2 free unlocks

Unlock quizzes for free by uploading documents