Below is a histogram of the ages of the professors at a large university. 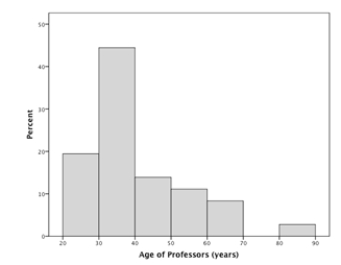 The overall shape of this distribution is
A) skewed to the right.
B) skewed to the left.
C) roughly symmetric.
D) without a clear shape.
Correct Answer:
Verified
Q8: You are giving a talk about the
Q9: To display the percent of likely voters
Q10: You want to make a graph to
Q11: A stemplot is
A) the same as a
Q12: To display the number of pets owned
Q14: Below is a histogram of the number
Q15: Here is a set of data: 1300,
Q16: You want to make a graph that
Q17: An analyst wants to draw a graph
Q18: Below is a histogram of the ages
Unlock this Answer For Free Now!
View this answer and more for free by performing one of the following actions

Scan the QR code to install the App and get 2 free unlocks

Unlock quizzes for free by uploading documents