A random sample of patients who attended a clinic was selected. The age of the patient (years) and the number of days since the last visit were collected and are displayed in the figure below. The least-squares regression line for predicting number of days since the last visit from the age of the patient is y = 600.081 - 8.694x. 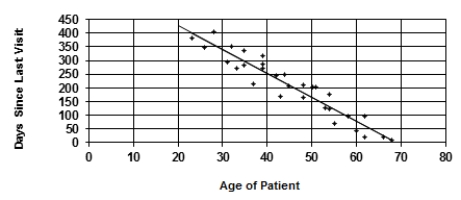 The slope of this line tells us the
A) correlation between age of patient and days since last visit.
B) change in days since last visit for each year older a patient is, on average.
C) change in the age of the patient for each extra day since the last visit.
D) average days since last visit for all of the patients.
Correct Answer:
Verified
Q14: If the least-squares regression line for predicting
Q15: What can we say about the relationship
Q16: A high correlation between two variables does
Q17: A report in a medical journal notes
Q18: If there were something genetic which made
Q20: In a fisheries researcher's experiment, the correlation
Q21: Students who study statistics in college tend
Q22: The correlation between two variables x and
Q23: Lean body mass (your weight leaving out
Q24: A year-long fitness center study sought to
Unlock this Answer For Free Now!
View this answer and more for free by performing one of the following actions

Scan the QR code to install the App and get 2 free unlocks

Unlock quizzes for free by uploading documents