Figure 27-1.The figure shows a utility function. 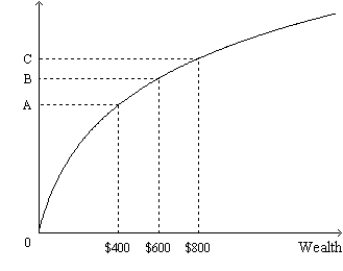
-Refer to Figure 27-1.Which distance along the vertical axis represents the marginal utility of an increase in wealth from $600 to $800?
A) the distance between the origin and point B
B) the distance between the origin and point C
C) the distance between point A and point C
D) the distance between point B and point C
Correct Answer:
Verified
Q1: Figure 27-1.The figure shows a utility function.
Q2: Matt's Utility Function Q3: Figure 27-2.The figure shows a utility function Q5: Figure 27-1.The figure shows a utility function.![]()
Unlock this Answer For Free Now!
View this answer and more for free by performing one of the following actions

Scan the QR code to install the App and get 2 free unlocks

Unlock quizzes for free by uploading documents