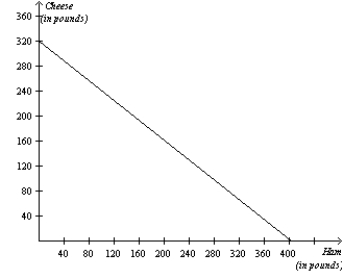
Figure 3-23
The graph below represents the various combinations of ham and cheese (in pounds) that the nation of Bonovia could produce in a given month. 
-Refer to Figure 3-23.Whenever Bonovia increases its production of ham by 1 pound per month,then it must decrease its production of cheese by
A) 0.75 pound.
B) 0.80 pound.
C) 1.00 pounds.
D) 1.25 pounds.
Correct Answer:
Verified
Q122: Figure 3-23
The graph below represents the various
Q123: Figure 3-22
Alice and Betty's Production Possibilities in
Q124: Figure 3-21
Uzbekistan's Production Possibilities Frontier
Azerbaijan's Production Possibilities
Q125: Figure 3-21
Uzbekistan's Production Possibilities Frontier
Azerbaijan's Production Possibilities
Q126: Figure 3-21
Uzbekistan's Production Possibilities Frontier
Azerbaijan's Production Possibilities
Q128: Figure 3-23
The graph below represents the various
Q129: Figure 3-21
Uzbekistan's Production Possibilities Frontier
Azerbaijan's Production Possibilities
Q130: Figure 3-23
The graph below represents the various
Q131: Figure 3-22
Alice and Betty's Production Possibilities in
Q132: Figure 3-21
Uzbekistan's Production Possibilities Frontier
Azerbaijan's Production Possibilities
Unlock this Answer For Free Now!
View this answer and more for free by performing one of the following actions

Scan the QR code to install the App and get 2 free unlocks

Unlock quizzes for free by uploading documents