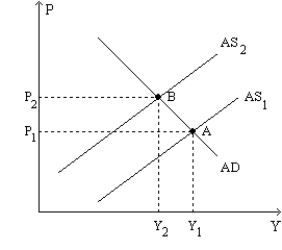
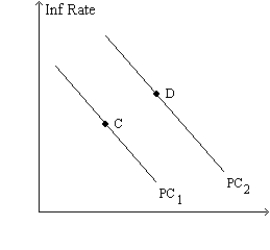
Figure 35-9.The left-hand graph shows a short-run aggregate-supply (SRAS) curve and two aggregate-demand (AD) curves.On the right-hand diagram,"Inf Rate" means "Inflation Rate." 

-Refer to Figure 35-9.A significant increase in the world price of oil could explain
A) the shift of the aggregate-supply curve from AS1 to AS2,but it could not explain the shift of the Phillips curve from PC1 to PC2.
B) the shift of the Phillips curve from PC1 to PC2,but it could not explain the shift of the aggregate-supply curve from AS1 to AS2.
C) both the shift of the aggregate-supply curve from AS1 to AS2 and the shift of the Phillips curve from PC1 to PC2.
D) neither the shift of the aggregate-supply curve from AS1 to AS2 nor the shift of the Phillips curve from PC1 to PC2.
Correct Answer:
Verified
Q12: Which of the following is not associated
Q13: Figure 35-9.The left-hand graph shows a short-run
Q14: Figure 35-9.The left-hand graph shows a short-run
Q15: Figure 35-9.The left-hand graph shows a short-run
Q16: A favorable supply shock causes the price
Q18: Figure 35-9.The left-hand graph shows a short-run
Q19: Figure 35-9.The left-hand graph shows a short-run
Q20: Which of the following results in higher
Q21: A favorable supply shock will shift short-run
Q22: If a central bank wants to counter
Unlock this Answer For Free Now!
View this answer and more for free by performing one of the following actions

Scan the QR code to install the App and get 2 free unlocks

Unlock quizzes for free by uploading documents