Multiple Choice
Figure 4-10 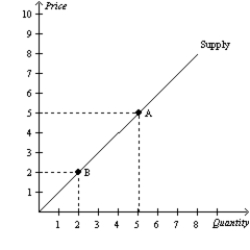
-Refer to Figure 4-10.The movement from Point A to Point B represents a(n)
A) shift in the supply curve.
B) decrease in the quantity supplied.
C) increase in the quantity supplied.
D) Both a and b are correct.
Correct Answer:
Verified
Related Questions
Q1: Holding the nonprice determinants of supply constant,a
Q4: An increase in quantity supplied
A)results in a
Q5: Other things equal,when the price of a
Q6: An decrease in the price of oranges
Unlock this Answer For Free Now!
View this answer and more for free by performing one of the following actions

Scan the QR code to install the App and get 2 free unlocks

Unlock quizzes for free by uploading documents