Multiple Choice
Figure 5-14 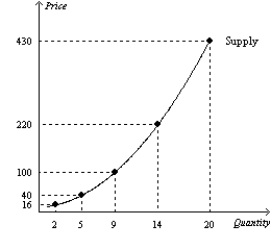
-Refer to Figure 5-14.Over which range is the supply curve in this figure the least elastic?
A) $16 to $40
B) $40 to $100
C) $100 to $220
D) $220 to $430
Correct Answer:
Verified
Related Questions
Q39: If the price elasticity of supply is
Q40: If a 30 percent change in price
Q41: Figure 5-14 Q42: Figure 5-14 Q43: Holding all other factors constant and using Q45: An increase in the price of cheese Q46: Suppose that an increase in the price Q47: Holding all other factors constant and using Q48: A bakery would be willing to supply Q49: Figure 5-15 Unlock this Answer For Free Now! View this answer and more for free by performing one of the following actions Scan the QR code to install the App and get 2 free unlocks Unlock quizzes for free by uploading documents![]()
![]()
![]()

