Refer to the graph. 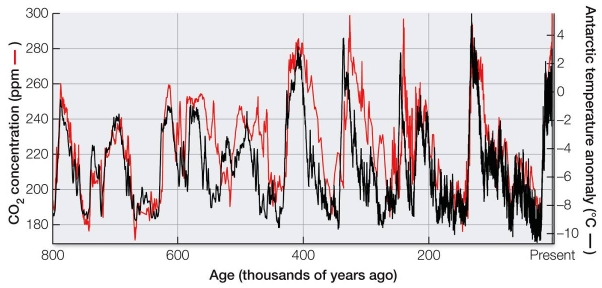 The graph shows both atmospheric CO2 concentration and Antarctic atmospheric temperature anomaly over the past 800,000 years.Discuss the significance of the correlation between these two factors.How do they relate to climate change today?
Correct Answer:
Verified
View Answer
Unlock this answer now
Get Access to more Verified Answers free of charge
Q114: Refer to the figure. Q115: This food chain in a California river Q116: A wetland is in danger from developers.You Q117: Briefly contrast the flow of energy and Q118: Refer to the figure. Q120: Discuss why some people do not understand![]()

Unlock this Answer For Free Now!
View this answer and more for free by performing one of the following actions

Scan the QR code to install the App and get 2 free unlocks

Unlock quizzes for free by uploading documents