Refer to the graph, showing a continual increase in CO2 since measurements began about 1960. 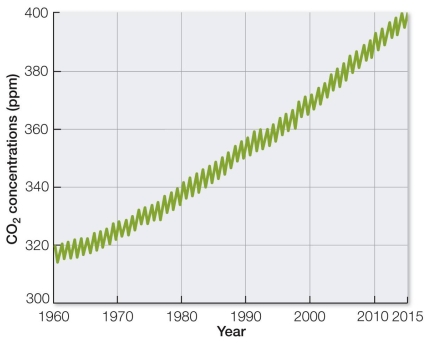 Which type of data, when added to the data in this graph, would not provide evidence of a connection between rising CO2 levels and rising global temperatures?
A) Atmospheric temperatures over thousands of years
B) Atmospheric temperatures since 1960
C) A climate model correlating rising temperatures with rising CO2
D) Chemistry experiment results showing that CO2 traps heat
E) Measurements showing CO2 being dissolved in the oceans
Correct Answer:
Verified
Q47: The shortest residence time for water in
Q48: Refer to the figure. Q49: Scientists know that increasing CO2 traps more Q50: About half of the excess CO2 released Q51: Microbes, primarily bacteria, are responsible for all Q53: Coral reefs have been one of the Q54: An animal dies near the forest edge.Almost Q55: Which is the least likely fate of Q56: The flesh of a dead animal is Q57: During which process of the hydrologic cycle![]()
Unlock this Answer For Free Now!
View this answer and more for free by performing one of the following actions

Scan the QR code to install the App and get 2 free unlocks

Unlock quizzes for free by uploading documents