The graph below shows cycles of predators (lynx) and prey (snowshoe hares) over nearly a century.During this time, people were trapping both lynx and hares, thus limiting their populations. 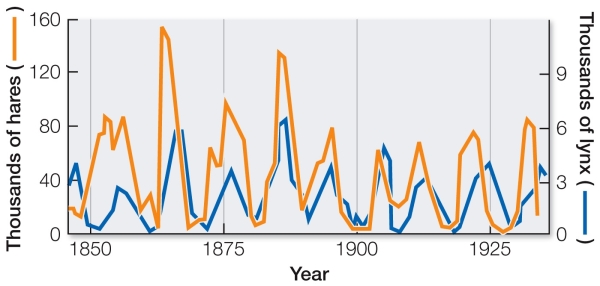 If trapping of both species declined, what changes would be expected to occur in the hare and lynx populations?
A) Cycles would continue but probably at higher levels.
B) Cycles would continue but probably at lower levels.
C) Both hare and lynx populations would increase, and cycles would stop.
D) Both hare and lynx populations would decrease, and cycles would stop.
E) Both hare and lynx populations would increase to their carrying capacities and level off.
Correct Answer:
Verified
Q46: Most plants defend themselves against herbivory by
Q47: Microscopic study of the contact lens fluid
Q48: Many scientists think the great number of
Q49: In nature, predator-prey cycles can continue for
Q50: In pregnant women, the Zika virus causes
Q52: The H1N1 influenza virus responsible for the
Q53: The biochemical diversity of plants is primarily
Q54: A bird is infested with the bloodsucking
Q55: The best characterization of pathogenic organisms is
Q56: A parasite lives in a chimpanzee's fur
Unlock this Answer For Free Now!
View this answer and more for free by performing one of the following actions

Scan the QR code to install the App and get 2 free unlocks

Unlock quizzes for free by uploading documents