Refer to the graph below. 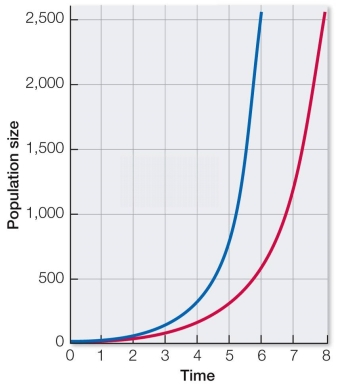 In the graph shown, what factor causes the difference in placement between the left and right growth curves?
A) The left curve has a greater per capita growth rate, or r.
B) The right curve has a greater per capita growth rate, or r.
C) The left curve has a larger starting population, or N0.
D) The right curve has a larger starting population, or N0.
E) The left curve changes by a constant number, the right by a constant proportion.
Correct Answer:
Verified
Q41: Which situation is an example of density-independent
Q42: A young hen is removed from an
Q43: In a goldfish population, the fitness of
Q44: Which assumption is not made in the
Q45: When the per capita growth rate of
Q47: In the logistic population growth curve shown
Q48: Refer to the paragraph below.
The African
Q49: Climate change is altering many aspects of
Q50: All of the populations described below would
Q51: Refer to the graph below. 
Unlock this Answer For Free Now!
View this answer and more for free by performing one of the following actions

Scan the QR code to install the App and get 2 free unlocks

Unlock quizzes for free by uploading documents