Refer to the graph showing body temperature and heart rate in the Galápagos marine iguana as it moves from feeding in the ocean to basking on hot rocks on shore. 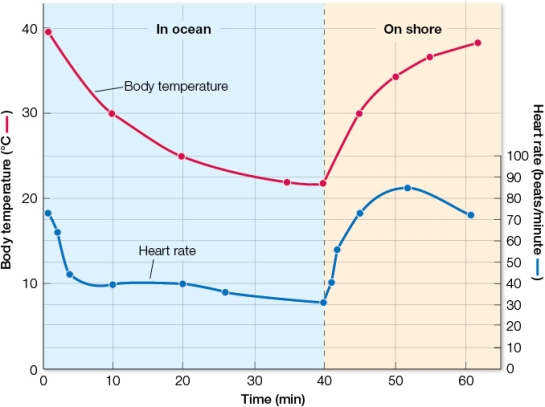 If you saw a Galápagos marine iguana sunning itself for over an hour on warm rocks, you would expect its body temperature to be around _______ and its heart rate to be around _______.
Correct Answer:
Verified
View Answer
Unlock this answer now
Get Access to more Verified Answers free of charge
Q130: Why would an endothermic animal's metabolic rate
Q131: When you start exercising, your breathing rate
Q132: Refer to the graph. Q133: Refer to the graph showing body temperature Q134: Tissues that secrete digestive juices into the Q136: Which statement about glial cells is true?![]()
A)
Unlock this Answer For Free Now!
View this answer and more for free by performing one of the following actions

Scan the QR code to install the App and get 2 free unlocks

Unlock quizzes for free by uploading documents