The table shows the average performance of different genotypes at the A locus for three different populations of lizards in two different environments.The number before the slash is for running speed (in meters per second) , and the number after the slash is for relative strength. 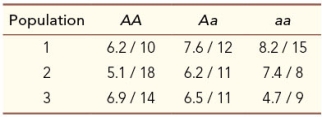 In which population is there evidence of a trade-off between running speed and relative strength?
A) Population 1 only
B) Population 2 only
C) Population 3 only
D) Both populations 1 and 2
E) Both populations 1 and 3
Correct Answer:
Verified
Q94: The most likely reason that subpopulations often
Q95: The genome of a virus with 9,000
Q96: An allele in a population of oysters
Q97: Which of the following can act as
Q98: The observation that females of a species
Q100: Charles Darwin and _ independently articulated the
Q101: In several species of insects, males with
Q102: Selection currently maintains an intermediate body size
Q103: In Drosophila melanogaster, body size increases as
Q104: If a change in the nucleotide, from
Unlock this Answer For Free Now!
View this answer and more for free by performing one of the following actions

Scan the QR code to install the App and get 2 free unlocks

Unlock quizzes for free by uploading documents