The graph shows the range of variation among population members for a trait determined by multiple genes. 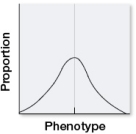 Suppose that there were no genetic component to this trait.If this population were subject to stabilizing selection for several generations, which distributions would be most likely to result? Assume that the environment stayed the same.
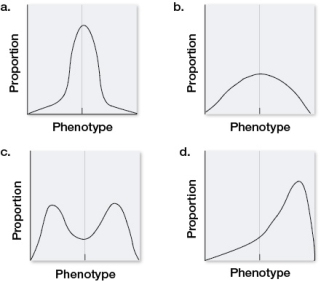
A) a
B) b
C) c
D) d
E) None of the above; there would be no change in the distribution.
Correct Answer:
Verified
Q1: Which vegetable was produced from wild mustard,
Q2: Which phrase best describes natural selection?
A) The
Q4: Suppose mutation and selection no longer occurred
Q5: Yeast cells are sequenced periodically to examine
Q6: Polydactyly (having more than five fingers on
Q7: The artificial selection experiments with bristle numbers
Q8: If variation at a given locus has
Q9: Which two evolutionary processes would most likely
Q10: Different populations of mice that were previously
Q11: High-throughput sequencing reveals that ten new mutations
Unlock this Answer For Free Now!
View this answer and more for free by performing one of the following actions

Scan the QR code to install the App and get 2 free unlocks

Unlock quizzes for free by uploading documents