Refer to the figure below. 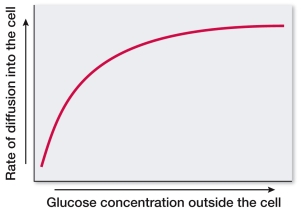 According to the graph, as the number of glucose molecules increases, the rate of diffusion across a membrane
A) increases indefinitely.
B) decreases.
C) increases until a plateau is reached.
D) can either increase or decrease.
E) remains unchanged.
Correct Answer:
Verified
Q66: In the intestine, Na+ and an amino
Q67: Both primary and secondary active transport
A) generate
Q68: Secondary active transport occurs in the small
Q69: Which is an example of passive transport?
A)
Q70: Refer to the figure below, which is
Q72: In passive transport, molecules move
A) against their
Q73: Refer to the figure below, which is
Q74: Facilitated diffusion and active transport both
A) require
Q75: For each molecule of ATP consumed during
Q76: Refer to the figure below showing concentrations
Unlock this Answer For Free Now!
View this answer and more for free by performing one of the following actions

Scan the QR code to install the App and get 2 free unlocks

Unlock quizzes for free by uploading documents