Multiple Choice
Which figure below is the correct graph of the linear equation x = 3?
A) 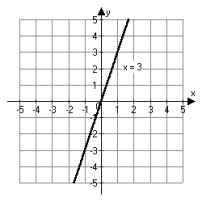
B) 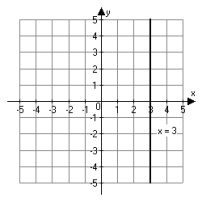
C) 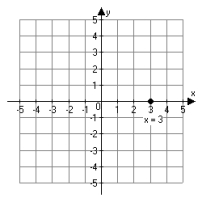
D) 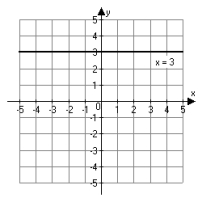
Correct Answer:
Verified
Related Questions
Q1: The budget deficit for the city of
Q2: Write the equation Q3: Which of the following is the correct Q4: Which point below is located at coordinates Q5: Line l goes through (3, 2) and Q7: Gotham City's budget deficit was $6.2 million Q8: The price of a 2-hour plumbing repair Q9: A playground equipment manufacturer plans to spend Q10: Complete the ordered pair so that it Q11: Write an equation in slope-intercept form for![]()
Unlock this Answer For Free Now!
View this answer and more for free by performing one of the following actions

Scan the QR code to install the App and get 2 free unlocks

Unlock quizzes for free by uploading documents