A technical writer wants to create a graphic showing the proportion of hurricanes that have hit each of the Gulf Coast states between 1900 and 2005. The graphic will be included in a safety brochure to be distributed to the public by the Federal Emergency Management Agency. Which graphic best displays these data?
A) 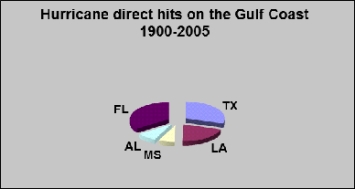
B) 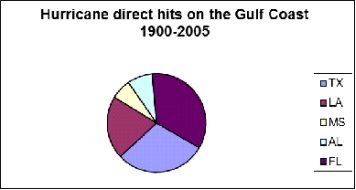
C) 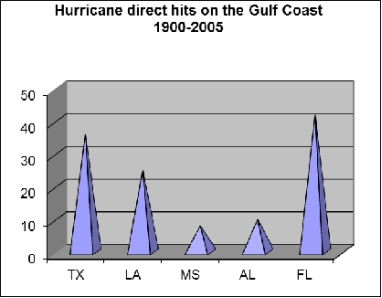
D) 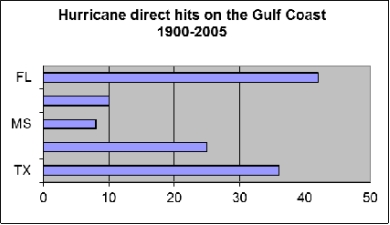
Correct Answer:
Verified
Q10: You are making a graphic for automotive
Q13: You are writing a report on the
Q14: Chapter 12 suggests that you consider four
Q16: Chapter 12 offers six principles for using
Q18: How can a writer avoid creating chartjunk?
A)
Q19: why do you need to cite the
Q20: Which of the following graphics would be
Q23: Chapter 12 identifies four stages in the
Q36: Why might you include a common, familiar
Q39: Which type of graphic does NOT use
Unlock this Answer For Free Now!
View this answer and more for free by performing one of the following actions

Scan the QR code to install the App and get 2 free unlocks

Unlock quizzes for free by uploading documents