A student counted the number of candies of each color in a bag of 57 Reese's Pieces.The results are shown in the following bar graph. 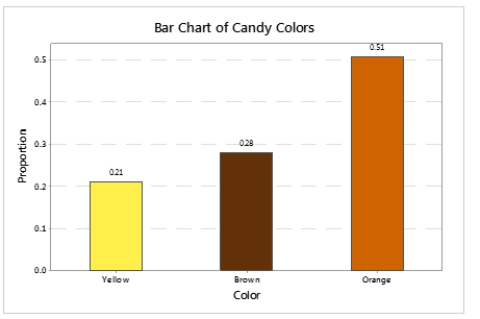 What percentage of the candies were NOT colored orange?
A) 21%
B) 28%
C) 49%
D) 51%
Correct Answer:
Verified
Q4: A distribution with only one peak is
Q11: Concerning univariate data, a _ or _
Q16: A data set consisting of observations on
Q17: When two distinct symmetric unimodal populations with
Q19: A frequency distribution table is BEST suited
Q21: A survey of the patients waiting to
Q22: A survey records the average study time
Q24: A student counted the number of candies
Q25: A survey records the number of U.S.states
Q26: A 2012 survey examined cell phone ownership
Unlock this Answer For Free Now!
View this answer and more for free by performing one of the following actions

Scan the QR code to install the App and get 2 free unlocks

Unlock quizzes for free by uploading documents