Given the following graphs, which graph represents fixed costs? 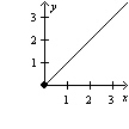
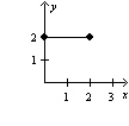
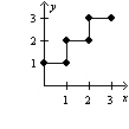

A) II
B) I
C) III
D) none of these
Correct Answer:
Verified
Q1: Fixed cost per unit is £9 when
Q5: Direct materials are an example of a
A)fixed
Q7: _ explain changes in costs as units
Q8: Holly Corporation has the following costs for
Q12: Which of the following would be an
Q13: _ explain changes in costs as factors
Q13: Which of the following costs is a
Q17: Which of the following statements is TRUE
Q64: When the volume of activity increases within
Q74: In a traditional cost management system, cost
Unlock this Answer For Free Now!
View this answer and more for free by performing one of the following actions

Scan the QR code to install the App and get 2 free unlocks

Unlock quizzes for free by uploading documents