Multiple Choice
 Which of the graphs in Figure 20-1 illustrates the behavior of a total variable cost?
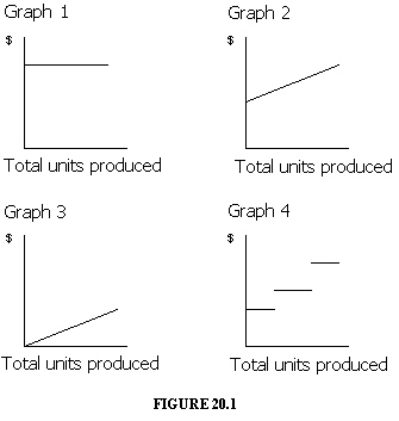
A) Graph 2
B) Graph 3
C) Graph 4
D) Graph 1
Correct Answer:
Verified
Related Questions
Q42: If fixed costs are $650,000 and the
Q46: In an absorption costing income statement, the
Q55: If the unit selling price is $40,
Unlock this Answer For Free Now!
View this answer and more for free by performing one of the following actions

Scan the QR code to install the App and get 2 free unlocks

Unlock quizzes for free by uploading documents