Use the following to answer questions:
Figure: Supply Shift 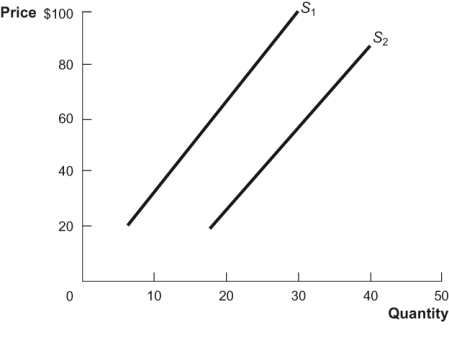
-(Figure: Supply Shift) What would cause the supply curve to shift from S1 to S2 as shown in the diagram?
A) an increase in taxes on firms' output
B) an increase in the price of inputs used to produce the output
C) a decrease in the number of firms that produce the output
D) a decrease in the wages paid to union workers who produce the output
Correct Answer:
Verified
Q142: Use the following to answer questions:
Figure: Producer
Q143: Figure: Supply Shift Q144: If prices rise, what happens to producer Q145: When the price of inputs increase:![]()
A) the
Unlock this Answer For Free Now!
View this answer and more for free by performing one of the following actions

Scan the QR code to install the App and get 2 free unlocks

Unlock quizzes for free by uploading documents