Figure: Price Elasticity of Supply 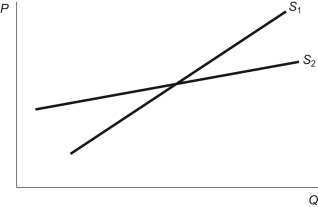 Refer to the figure. Compared to S1, S2 is more:
A) elastic since quantity supplied increases more with an increase in price.
B) elastic since quantity supplied increases less with an increase in price.
C) inelastic since quantity supplied increases more with an increase in price.
D) inelastic since quantity supplied increases less with an increase in price.
Correct Answer:
Verified
Q123: If the price of cocoa rises by
Q124: Use the following to answer questions:
Figure: Elasticity
Q125: The supply curve for oil is _
Q126: Which of the following explains why local
Q127: If the price elasticity of supply is
Q129: Why is the supply curve for oil
Q130: When production of a good can be
Q131: If the supply of raw materials is
Q132: A perfectly elastic supply curve is:
A) downward
Q133: Why do supply curves tend to be
Unlock this Answer For Free Now!
View this answer and more for free by performing one of the following actions

Scan the QR code to install the App and get 2 free unlocks

Unlock quizzes for free by uploading documents