Which of the graphs in Figure 20-1 illustrates the nature of a mixed cost?
A) Graph 2
B) Graph 3
C) Graph 4
D) Graph 1 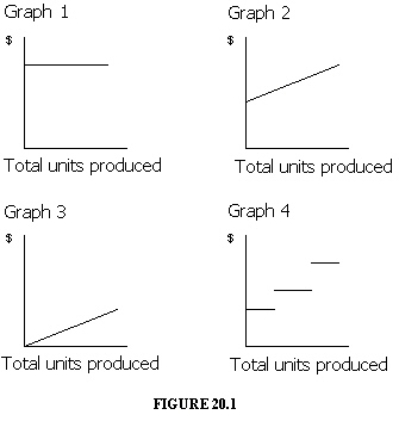
Correct Answer:
Verified
Q62: Which of the following is an example
Q71: Which of the following activity bases would
Q75: Which of the graphs in Figure 20-1
Q77: Which of the graphs in Figure 20-1
Q80: Most operating decisions of management focus on
Q82: As production increases, what should happen to
Q84: The manufacturing cost of Prancer Industries for
Q89: In cost-volume-profit analysis, all costs are classified
Q92: As production increases, what would you expect
Q100: Contribution margin is
A) the excess of sales
Unlock this Answer For Free Now!
View this answer and more for free by performing one of the following actions

Scan the QR code to install the App and get 2 free unlocks

Unlock quizzes for free by uploading documents