Use the following to answer questions :
Figure: Production Possibilities and Circular-Flow Diagram 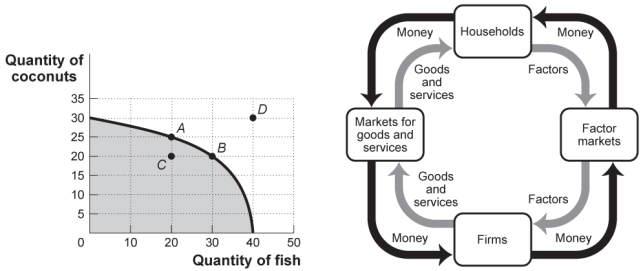
-(Figure: Production Possibilities and Circular-Flow Diagram) Look at the figure Production Possibilities and Circular-Flow Diagram. Assume the two figures represent the same economy. Suppose that in the circular-flow diagram there is a significant decrease in the amount of labor flowing to the firms that produce coconuts. If all other variables remain unchanged, this adjustment in the economy would be best represented in the production possibilities figure by a move from point A toward:
A) point A (no movement) .
B) point B (a decrease in coconut production and an increase in fish production) .
C) point C (a decrease in coconut production) .
D) point D (an outward shift of the entire curve) .
Correct Answer:
Verified
Q177: Mark and Julie are going to sell
Q181: A high-school graduate who gets a college
Q186: If the opportunity cost of manufacturing automobiles
Q193: Which of the following is NOT a
Q194: Use the following to answer questions :
Figure:
Q194: In the simplest circular-flow model,households supply _
Q196: The circular-flow diagram illustrates how households _
Q199: Use the following to answer questions :
Figure:
Q202: Jim is being paid $7.25 an hour
Q212: In the circular-flow diagram,the product market is
Unlock this Answer For Free Now!
View this answer and more for free by performing one of the following actions

Scan the QR code to install the App and get 2 free unlocks

Unlock quizzes for free by uploading documents