Use the following to answer questions :
Table: Price and Output Data 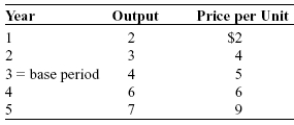
-(Table: Price and Output Data) Look at the table Price and Output Data. Between years 2 and 3, nominal GDP increased by:
A) 33%.
B) 25%.
C) 67%.
D) 8%.
Correct Answer:
Verified
Q285: Use the following to answer questions :
Table:
Q286: Use the following to answer questions :
Table:
Q287: Use the following to answer questions :
Table:
Q288: The purpose of indexing Social Security payments
Q289: The major difference between the producer price
Q291: Use the following to answer questions :
Table:
Q292: The producer price index is often regarded
Q293: Use the following to answer questions :
Table:
Q294: Use the following to answer questions :
Table:
Q295: Use the following to answer questions :
Table:
Unlock this Answer For Free Now!
View this answer and more for free by performing one of the following actions

Scan the QR code to install the App and get 2 free unlocks

Unlock quizzes for free by uploading documents