The figure below shows the revenue and cost curves of a profit-maximizing monopolist. Based on the figure, the monopolist will produce _____.Figure 8-2: 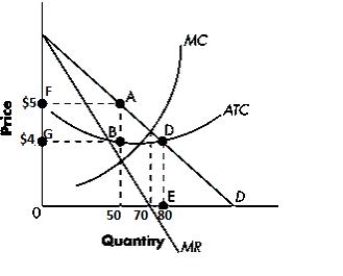
A) 70 units of output
B) 50 units of output
C) 80 units of output
D) 60 units of output
E) 75 units of output
Correct Answer:
Verified
Q48: If a profit-maximizing monopolist finds that marginal
Q49: Which of the following is not generally
Q50: Which of the following is a major
Q51: A perfectly competitive firm and a monopoly
Q52: If the average total cost curve is
Q54: The figure below shows the revenue and
Q55: The figure below shows the revenue and
Q56: A monopolist can sell 20 units a
Q57: At a given level of output, a
Q58: The figure below shows the revenue and
Unlock this Answer For Free Now!
View this answer and more for free by performing one of the following actions

Scan the QR code to install the App and get 2 free unlocks

Unlock quizzes for free by uploading documents