The following graph shows the demand and supply curves of a good. Identify the areas of consumer and producer surplus when the market price equals $20.Figure 4.2: 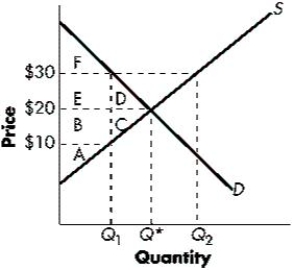
Correct Answer:
Verified
View Answer
Unlock this answer now
Get Access to more Verified Answers free of charge
Q78: If the elasticity of supply coefficient equals
Q79: If the supply curve of a good
Q80: A price floor is binding when it
Q81: Among the following pairs, which is likely
Q82: The demand curve for a good is
Q84: Explain the impact of:
a. A rent ceiling
Q85: If a consumer buys six units of
Q86: Prices have soared for parking facilities in
Q87: Phil and Lasca have always wanted to
Q88: In a recent fare war, America West
Unlock this Answer For Free Now!
View this answer and more for free by performing one of the following actions

Scan the QR code to install the App and get 2 free unlocks

Unlock quizzes for free by uploading documents