Graph A below shows an elastic demand curve, and Graph B shows an inelastic demand curve. With reference to Graph A, at a price of $10, total revenue equals _____.Figure 4.1: 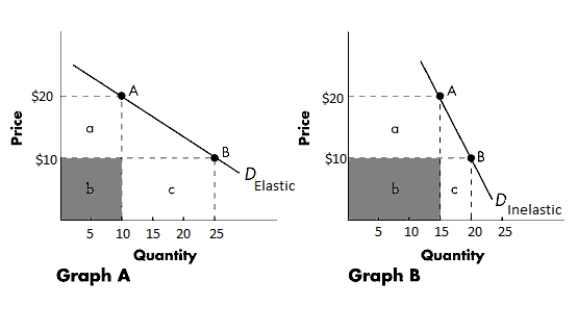
A) $250
B) $400
C) $500
D) $1,000
E) $150
Correct Answer:
Verified
Q49: If the demand for a good is
Q50: Identify the correct statement about the price
Q51: Graph A below shows an elastic demand
Q52: A subsidy to wheat farmers decreases the
Q53: If the demand for a good is
Q55: The table below shows the price elasticity
Q56: The long-run demand curve for wheat is
Q57: The following table shows Tim's demand for
Q58: The table below shows the price elasticity
Q59: A linear demand curve for a good
Unlock this Answer For Free Now!
View this answer and more for free by performing one of the following actions

Scan the QR code to install the App and get 2 free unlocks

Unlock quizzes for free by uploading documents