Multiple Choice
Figure 15-9 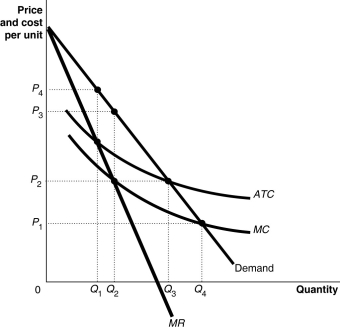
Figure 15-9 shows the cost and demand curves for the Erickson Power Company.
-Refer to Figure 15-9.The firm would maximize profit by producing
A) Q1 units.
B) Q2 units.
C) Q3 units.
D) Q4 units.
Correct Answer:
Verified
Related Questions
Q132: A merger between two competitors may be

