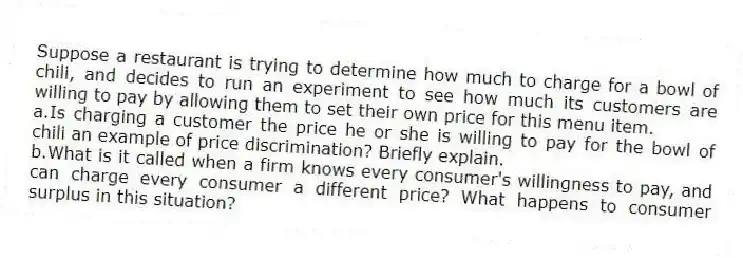
Suppose a restaurant is trying to determine how much to charge for a bowl of chili, and decides to run an experiment to see how much its customers are willing to pay by allowing them to set their own price for this menu item.
a.Is charging a customer the price he or she is willing to pay for the bowl of chili an example of price discrimination? Briefly explain.
b.What is it called when a firm knows every consumer's willingness to pay, and can charge every consumer a different price? What happens to consumer surplus in this situation?
Correct Answer:
Verified
View Answer
Unlock this answer now
Get Access to more Verified Answers free of charge
Q166: The Clayton Act of 1936 outlawed price
Q167: Draw a graph that shows producer surplus,
Q168: Delaware and North Dakota have identical state
Q169: What is yield management? How is yield
Q170: Racial discrimination and other forms of discrimination
Q172: What three conditions must hold for a
Q173: Your text refers to airlines as "The
Q174: Arnold's Airport Transport provides passenger transportation to
Q175: One method of setting price using the
Q176: Suppose the per-unit production cost of a
Unlock this Answer For Free Now!
View this answer and more for free by performing one of the following actions

Scan the QR code to install the App and get 2 free unlocks

Unlock quizzes for free by uploading documents