State the type of graphical display for Graph A and Graph B. 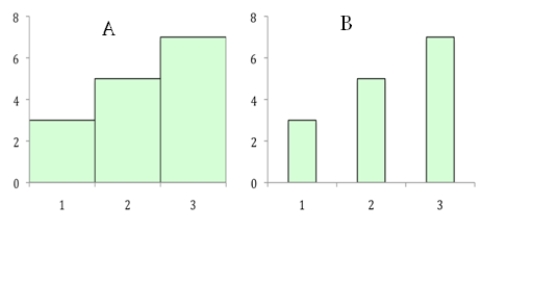
A) A is a bar chart;B is a histogram.
B) B is a bar chart;A is a histogram.
C) Both graphs are bar charts.
D) Both graphs are histograms.
Correct Answer:
Verified
Q41: The midpoint of a given interval is
Q45: Ungrouped data are always distributed in intervals.
Q54: A researcher records the number of children
Q56: A researcher measures the weight (in ounces)of
Q58: Bar charts are a lot like histograms,except
A)the
Q59: Summarizing data in a table or graph
Q60: Frequency distributions summarize the average scores in
Q60: The real range is the difference between
Q72: In a bar chart,each class or category
Q77: A frequency polygon,but not an ogive,can be
Unlock this Answer For Free Now!
View this answer and more for free by performing one of the following actions

Scan the QR code to install the App and get 2 free unlocks

Unlock quizzes for free by uploading documents