Which of the following graphs illustrates the behavior of a total fixed cost? 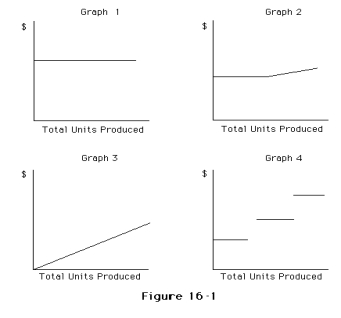
A) Graph 2
B) Graph 3
C) Graph 4
D) Graph 1
Correct Answer:
Verified
Q44: Even if a business sells six products,
Q50: If the volume of sales is $6,000,000
Q51: If fixed costs are $450,000 and the
Q51: Only a single line, which represents the
Q52: Which of the following activity bases would
Q53: If a business sells four products,it is
Q53: Cost-volume-profit analysis can be presented in both
Q60: Only a single line, which represents the
Q60: If the unit selling price is $40,the
Q61: Which of the following costs is an
Unlock this Answer For Free Now!
View this answer and more for free by performing one of the following actions

Scan the QR code to install the App and get 2 free unlocks

Unlock quizzes for free by uploading documents