The graph below shows the O2-binding curves for myoglobin (Mb)and hemoglobin (Hb).
a.Label the two curves (indicate which one represents Mb and which one represents Hb). 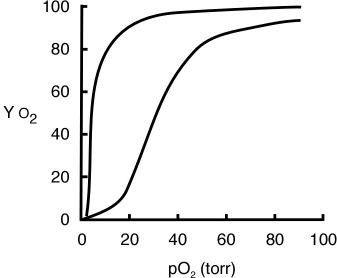
b.Use the graph to determine the Kd of myoglobin for O2 (show your approach).
c.What is the difference between myoglobin and hemoglobin that cause the O2-binding curves to so be different?
d.Why is it important that hemoglobin has these particular O2-binding characteristics?
Correct Answer:
Verified
b.Kd equals 3-4 torr (see ...
View Answer
Unlock this answer now
Get Access to more Verified Answers free of charge
Q58: Muscle contraction is directly caused by
A)structural changes
Q59: Which of the following statements about actin
Q60: Hemoglobin S,the variant responsible for the misshapen
Q61: The Ig fold can be described
Q62: IgG is one of five classes of
Q64: Which statement about antigen-binding sites in antibodies
Q65: Which class of antibodies has been implicated
Q66: How many antigen-binding sites are present on
Q67: Fab fragments can be generated by
A)reduction of
Q68: What is the primary physiological function of
Unlock this Answer For Free Now!
View this answer and more for free by performing one of the following actions

Scan the QR code to install the App and get 2 free unlocks

Unlock quizzes for free by uploading documents