The following graph shows the market for pollution rights. The shift of the demand curve from D to D' indicates that ______.
Figure 17.4
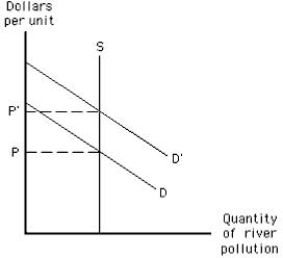
A) producers want to discharge more pollution into the river
B) producers want to use more of the river in a nonpolluting way
C) consumers want producers to clean up the polluted river
D) consumers want to buy goods that use technology that does not pollute
E) consumers want to buy technology that reduces pollution
Correct Answer:
Verified
Q84: According to the Coase theorem,_
A)government regulation is
Q89: The marginal social benefit curve for water
Q93: Which of the following is not used
Q94: A metal stamping factory moves next to
Q97: A metal-stamping factory moves next to a
Q99: A meditation class meets on the second
Q100: If production is characterized by variable technology
Q101: The following graph shows the market for
Q102: A major source of water pollution in
Q103: The following graph shows the market for
Unlock this Answer For Free Now!
View this answer and more for free by performing one of the following actions

Scan the QR code to install the App and get 2 free unlocks

Unlock quizzes for free by uploading documents