The following graph shows market equilibrium in the presence of an externality. The socially efficient price and level of output are:
Figure 17.2
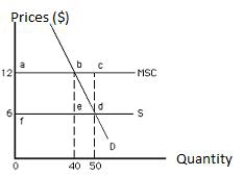
A) $6 and 50 units, respectively
B) $12 and 50 units, respectively
C) $12 and 40 units, respectively
D) $6 and 40 units, respectively
E) less than $6 and more than 50 units, respectively
Correct Answer:
Verified
Q30: Suppose a city builds a new park
Q37: The common-pool problem arises _
A)when goods are
Q46: At the market output and price for
Q55: The following graph shows market equilibrium in
Q56: The following graph shows equilibrium in a
Q57: Open-access resources are owned by:
A)every individual in
Q58: Which of the following is an example
Q61: The marginal external cost is:
A)the additional cost
Q64: The socially efficient level of output is
Q80: A tannery discovers a technology that makes
Unlock this Answer For Free Now!
View this answer and more for free by performing one of the following actions

Scan the QR code to install the App and get 2 free unlocks

Unlock quizzes for free by uploading documents