The following graph shows the demand and supply curves of a resource. The equilibrium price of the resource is _____. Figure 11.3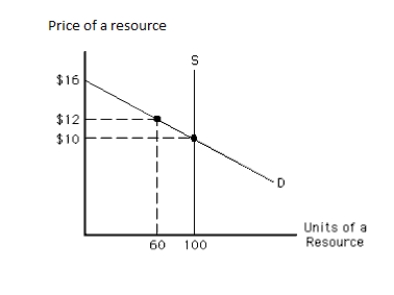
A) $16
B) $12
C) $10
D) less than $10
E) more than $12 but less than $16
Correct Answer:
Verified
Q74: The following graph shows the labor market.
Q75: The following graph shows the labor market.
Q76: The following graph shows the demand and
Q77: The following graph shows the labor market.
Q78: The following graph shows the demand and
Q80: The following graph shows the demand and
Q82: The following graph shows the demand and
Q83: The following graph shows the demand and
Q84: The following graph shows the demand and
Q94: A game show host who gave up
Unlock this Answer For Free Now!
View this answer and more for free by performing one of the following actions

Scan the QR code to install the App and get 2 free unlocks

Unlock quizzes for free by uploading documents