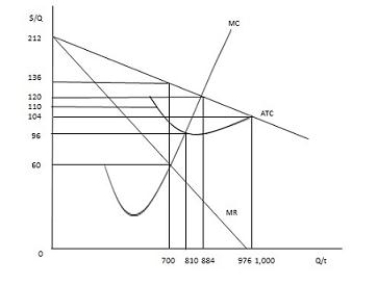
The figure below shows the cost and revenue curves for a monopolist. If the monopolist chooses to produce 1,000 units and does not discriminate among its customers, its total profit will be _____.
Figure 9.6
A) $0
B) $104,000
C) $212,000
D) maximized
E) negative
Correct Answer:
Verified
Q86: The figure below shows the cost and
Q87: The figure below shows the total cost
Q88: The figure below shows the cost and
Q89: The figure below shows the cost and
Q89: If the marginal cost of production for
Q92: Suppose a restaurant has a monopoly in
Q93: The figure below shows the total cost
Q94: The figure below shows the cost and
Q95: The figure below shows the total cost
Q96: The figure below shows the cost and
Unlock this Answer For Free Now!
View this answer and more for free by performing one of the following actions

Scan the QR code to install the App and get 2 free unlocks

Unlock quizzes for free by uploading documents