The figure below shows the cost and revenue curves faced by a monopolist. The profit-maximizing output and price for the monopolist are:
Figure 9.1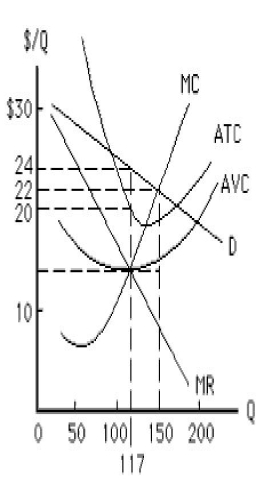
A) 117 units and $14, respectively.
B) 150 units and $22, respectively.
C) 150 units and $14, respectively.
D) 117 units and $22, respectively.
E) 117 units and $24, respectively.
Correct Answer:
Verified
Q37: Which of the following is true of
Q37: Suppose a monopolist must choose between two
Q38: According to the information provided in the
Q39: $0.Given the information in the table below,
Q40: Which of the following describes a monopolized
Q40: As a monopolist increases the quantity of
Q43: The figure below shows the cost and
Q44: Suppose a single firm supplies all the
Q45: Which of the following can be concluded
Q46: The figure below shows a non-discriminating monopolist.
Unlock this Answer For Free Now!
View this answer and more for free by performing one of the following actions

Scan the QR code to install the App and get 2 free unlocks

Unlock quizzes for free by uploading documents