The following diagram shows the market demand schedule for a good. When the price of the good is P, the shaded area represents:
Figure 6.5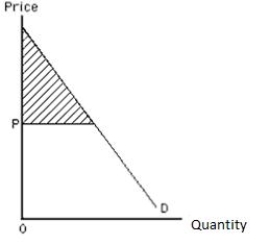
A) shortage.
B) marginal utility of the good.
C) price floor.
D) consumer surplus.
E) marginal valuation of the good.
Correct Answer:
Verified
Q105: A decrease in price along the elastic
Q111: The following image shows the demand curve
Q112: Jerry consumes three hamburgers at McDonald's. He
Q113: The following diagram shows Ken's demand curve
Q114: Elvis values the first gravy sandwich at
Q117: Suppose Hannah spends $3 to buy five
Q119: The following image shows the demand curve
Q119: If a consumer buys a good,the expected
Q134: Which of the following is true when
Q154: People who use drive-through windows at restaurants
Unlock this Answer For Free Now!
View this answer and more for free by performing one of the following actions

Scan the QR code to install the App and get 2 free unlocks

Unlock quizzes for free by uploading documents